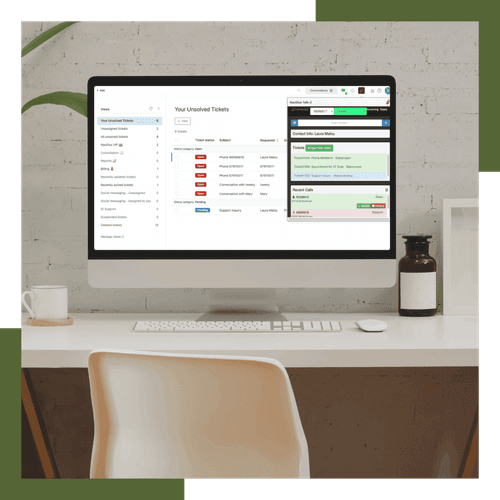
Your contact centre generates an enormous amount of data every day. The difference between a good contact centre and a brilliant one is how that data is used. This month, we're highlighting the best practices for maximising the value of your Nautilus Call Distribution Reports, the indispensable tool for boosting efficiency and customer satisfaction.
1. The Core Metrics: Monitoring the Pulse of Your Service
The Call Distribution Report is your contact centre's essential performance tracker. To get a holistic view of performance and identify immediate areas for improvement, focus on these critical metrics:

2. Going Granular: The Power of Targeted Analysis
General numbers are fine, but Nautilus gives you the tools for razor sharp insight. Leverage our filtering capabilities for truly actionable intelligence:
Queue Specific Analysis:
Isolate reports by specific queues (e.g., Billing, Technical Support, Sales). This allows you to measure individual team performance and reallocate skilled resources precisely where they are needed most.
Time Based Trendspotting:
Use filters for month, day of the week, or hour to build an accurate picture of demand. Use this data to move your staffing from reactive to proactive, ensuring every busy period is covered.
Historical Data Review:
Don’t just live in the moment. Adjust date ranges to analyse long-term trends and scientifically measure the impact of any recent process or feature changes you've implemented.
Visual Data Interpretation:
Use the built-in charts for a visual overview to make complex data easy to digest and facilitates quicker, more confident decision making.
3. Quality Assurance: Deconstructing the Interaction
Metrics tell you what happened, a deep dive tells you why. Nautilus Reports empower you to go beyond the summary:
Individual Call Review:
Expand the reports to view details of specific calls. This is invaluable for agent coaching and quality assurance, allowing supervisors to analyse resolution paths, agent performance, and customer sentiment for targeted training.
Call Summary:
Generate summaries for calls in your reports. Instead of listening to a 1 hour recording, supervisors can quickly read a concise breakdown of the customer's issue and the resolution. This is a massive time-saver for Quality Assurance (QA) and agent coaching.
Sentiment Analysis:
See an objective rating of the caller's mood (Positive, Neutral, Negative) integrated right into the report to instantly flag interactions that require a follow up or a deeper review, allowing you to proactively rescue customer relationships.
4. Operational Excellence: Translating Data to Strategy
The ultimate goal of these reports is to drive action. Use the insights from your Nautilus data to implement these strategic improvements:
Accurate Peak Call Time Forecasting:
Use your historical, time-based trends to build highly accurate staff forecasts. Minimise wait times and improve service levels by ensuring agents are logged in precisely when your customers are calling.
Effective Resource Allocation:
Move beyond simply hiring more staff. Allocate the right number of agents with the appropriate skills to the right queues during peak hours, optimising efficiency and drastically reducing operational costs.
Continuous Improvement for Customer Satisfaction:
By establishing a cycle of consistently analysing your reports, acting on the insights, and then re-measuring the results, your contact centre can continuously refine its operations, leading to enhanced service delivery and a superior caller experience.
Nautilus Call Distribution Reports are more than data, they are the blueprint for your customer service success. Transform your reports from static data points into powerful tools for informed, strategic decision-making.
Want to learn how to set up customised dashboards for your key queues?
Contact us today to schedule an optimisation session!


